

At a Glance
- Pattern
- Chamber size and muscle mass, seen as voltage in the leads that face each chamber, and as P-wave size and shape for the atria.
- Normal (Adult)
- S V1 + R V5/V6 <35 mm; R aVL + S V3 ≤28 mm men or ≤20 mm women; P <2.5 mm in II, III, aVF; P <120 ms, not notched; initial P in V1 <1.5 mm.
- Confirm It
- Voltage in mm on 10 mm/mV paper; P duration (ms) and notch in II; P amplitude in II and V1. Confirm calibration and lead placement first.
- Abnormal → Think
- High voltage with strain: LVH, confirm with echo
- P ≥2.5 mm in II or V1 ≥1.5 mm: right atrial enlargement
- P ≥120 ms, notched in II: left atrial enlargement
- Red Flags
- Strain plus chest pain: possible ACS, not LVH alone
- New RV pattern with dyspnea: consider pulmonary embolism
- New ST elevation in V1–V3: STEMI pathway if dynamic
- Bedside Action
- Fix leads and repeat the ECG. Compare with a prior tracing. Chest pain: serial 12-leads and the STEMI pathway per protocol. No drug is indicated by voltage alone.
Physiology & What It Represents
The ECG sees chamber size as force. A bigger or thicker chamber pushes harder, and the leads that face that chamber show it. Taller or deeper waves, wider waves, or a changed pattern in that territory. The P wave is the atria firing, spreading from the sinoatrial node through both of them. A bigger atrium takes longer to fire and throws a bigger P wave. That is why atrial enlargement shows up as a change in P-wave height, width or shape.
The QRS is the ventricles firing. In LVH, the R waves in the left-sided leads grow tall (I, aVL, V5–V6), and the S waves in the right chest leads grow deep. That is the logic behind Sokolow-Lyon: add the S in V1 to the R in V5 or V6. RVH tips the balance the other way. A dominant R appears in V1, and the QRS axis swings to the right.
- Why it matters at the bedside: a new voltage pattern can mean long-standing pressure load. It can also come from lead placement, chronic lung disease or an ischemic-looking repolarization pattern that mimics a heart attack.
Normal Values & How to Measure
| Parameter | Adult Normal | Pediatric Note | Where / How to Measure |
|---|---|---|---|
| Sokolow-Lyon voltage | S in V1 + R in V5 or V6 <35 mm (<3.5 mV) | Use age-specific references | Sum of the S wave in V1 and the taller R in V5 or V6, mm |
| Cornell voltage | R in aVL + S in V3 ≤28 mm men; ≤20 mm women | Use age-specific references | Sum of R in aVL and S in V3, mm; sex-specific |
| Romhilt-Estes score | <4 points: LVH unlikely | Not validated here for children | Add the points in the LVH section; 5 or more points is LVH |
| P-wave duration | <120 ms (0.12 s; 3 small boxes) | Age-specific limits | Lead II, first deflection to return to baseline |
| P-wave amplitude | <2.5 mm in II, III or aVF | Age-specific limits | Peak of the P wave in lead II (1 mm = 0.1 mV) |
| Initial positive P in V1 | <1.5 mm | Age-specific limits | The positive part of the P wave in V1 |
| Terminal negative P in V1 | Less than 1 mm deep, or less than 40 ms wide | Age-specific limits | The negative part of the P wave in V1; depth in mm and width in ms |
- Confirm calibration: standard paper speed 25 mm/s and gain 10 mm/mV. A tracing at half gain halves every voltage, so check the calibration pulse first.
- Check lead placement: V1–V2 belong in the fourth intercostal space at the sternal edge, and V4–V6 on the standard chest positions. Record any nonstandard position.
- Measure QRS voltage: from the isoelectric baseline to the peak or trough in mm, in the same beat and lead. Average several beats in an irregular rhythm.
- Measure the P wave in lead II: duration in ms (with the small boxes in brackets) and the presence of a notch. Then read the amplitude in II, III and aVF.
- Measure V1 separately: the initial positive component (amplitude) and the terminal negative component (depth in mm and width in ms).
- Compare with a prior ECG: a change from a recent tracing carries more weight than a single value.
Left Ventricular Hypertrophy (LVH)
Left ventricular hypertrophy (LVH) is a thicker left ventricle: more muscle mass. On the ECG it shows up as high QRS voltage in the left-sided leads, often with a repolarization (strain) pattern. Voltage criteria screen for LVH, but their sensitivity is limited.
ECG Criteria
| Criterion | Threshold | Notes |
|---|---|---|
| Sokolow-Lyon | S in V1 + R in V5 or V6 ≥35 mm (3.5 mV) | Most widely used voltage rule. In the 2025 cohort its area under the curve against echo was 0.67, below Romhilt-Estes (0.72). |
| Cornell voltage | R in aVL + S in V3 >28 mm men; >20 mm women | Sex-specific thresholds. Had the lowest area under the curve against echo in a 2025 cohort (0.61). |
| Romhilt-Estes score | 5 or more points: LVH present; 4 points: probable; under 4: unlikely | Composite score (table below). Highest area under the curve against echo in the 2025 cohort (0.72). |
Romhilt-Estes Point Score
| Component | Points |
|---|---|
| Voltage, counted once: any one of R or S in a limb lead ≥20 mm; S in V1 or V2 ≥30 mm; R in V5 or V6 ≥30 mm | 3 |
| ST-T change typical of LVH (strain), without digoxin | 3 (1 if on digoxin) |
| Left atrial involvement: terminal P negativity in V1 ≥1 mm deep and ≥40 ms wide | 3 |
| Left axis deviation (QRS axis beyond −30°) | 2 |
| QRS duration ≥90 ms | 1 |
| Intrinsicoid deflection ≥50 ms in V5 or V6 | 1 |
Maximum 13 points. The voltage item counts once, for 3 points, however many of its thresholds are met.
Causes
- Chronic pressure or volume load: long-standing hypertension or valve disease
- Hypertrophic cardiomyopathy: septal hypertrophy with high voltage and repolarization change
- Long-term anabolic-androgenic steroid use: in one 2026 cohort of users, LVH was common.
Clinical Significance
- Low sensitivity: in the 2026 steroid cohort, Romhilt-Estes at 5 points caught 34% of echo LVH, with specificity 85%. Most echo-defined LVH was missed.
- False positives: young, slim adults and athletes can meet voltage criteria with no disease at all. Obesity pulls voltage down, so the criteria can miss real LVH.
- Rhythm limits: with LBBB, ventricular pacing or WPW pre-excitation, voltage criteria stop being reliable.
- Confirm with imaging: echo measures wall thickness and mass. Voltage alone does not establish LVH.
- Chest pain: LVH voltage does not explain new chest pain by itself. Let the LVH Strain and the ST-Elevation Mimic section guide the next step.

Right Ventricular Hypertrophy (RVH)
Right ventricular hypertrophy (RVH) is a thicker right ventricle, usually from long-term pressure on the pulmonary circulation. ECG criteria for RVH are specific but not sensitive. So each criterion you add makes the finding worth more.
ECG Criteria
- R wave in V1 ≥7 mm
- R/S ratio in V1 above 1
- Ventricular activation time in V1 above 35 ms
- R in V1 + S in V5 or V6 above 10.5 mm (Sokolow-Lyon variant for RVH)
- Rightward QRS axis: past +90°, which is the emphysema table cut-off. On its own the axis is a weak criterion, so treat it as supporting evidence only.
Causes
- Pulmonary hypertension of any cause
- Chronic obstructive pulmonary disease and emphysema: hyperinflation pulls limb voltage down, and it can produce RVH-type criteria.
- Acute right ventricular strain: pulmonary embolism. It can show strain without classic hypertrophy.
Clinical Significance
- Context needed: chronic lung hyperinflation can produce the same criteria. In a patient with lung disease, a positive criterion needs the prior tracing and the clinical picture before anyone calls it RVH.
- New pattern in an acutely ill patient: treat it as possible pulmonary embolism or acute RV failure until proven otherwise (see Bedside Management). Here, new T-wave inversion in V1–V4 can be the strain sign.
- A normal ECG does not exclude PE: as many as 20–25% of patients with PE show a normal tracing.
Right Atrial Enlargement (P Pulmonale)
Right atrial enlargement (RAE) is a P-wave pattern of a bigger right atrium or a heavier load, called P pulmonale. The right atrium drives the early part of the P wave. So the P is tall in the inferior leads, with a large positive start in V1. Width is not the clue here. A wide P points to the left atrium instead.
ECG Criteria
- Limb leads: P ≥2.5 mm in II, III or aVF (tall, peaked P)
- Lead V1: initial positive part of P ≥1.5 mm
- Axis: emphysema is described with a vertical P axis above +60°. Most normal adults sit between about +45° and +65°, so the axis alone is weak evidence.
Causes
- Pulmonary hypertension of any cause
- Chronic obstructive pulmonary disease: P pulmonale is common in emphysema. There, hyperinflation can drop the atrium and shift the P axis.
Clinical Significance
- Pattern, not diagnosis: in emphysema, P pulmonale may reflect hyperinflation and a downward-displaced right atrium, not true enlargement. Compare with a prior ECG.
- With symptoms: read a new atrial pattern with dyspnea, tachycardia or low SpO₂ against the whole clinical picture, pulmonary embolism included.
Left Atrial Enlargement (P Mitrale)
Left atrial enlargement (LAE) is a P-wave pattern of a bigger left atrium or higher left atrial pressure, called P mitrale. In lead II the P wave runs wide and notched. In V1, the terminal negative part dips deep and wide. Duration is the single most useful measure.
ECG Criteria
- Lead II: P wave ≥120 ms and notched (bifid)
- Lead V1: terminal negative part ≥1 mm deep and ≥40 ms wide
- Romhilt-Estes: the V1 terminal component is worth 3 points (see LVH).
Causes
- Raised left atrial pressure or volume, from any cause: the ECG flags the pattern. It does not name the cause.
Clinical Significance
- Best single criterion: in a 2025 cohort checked against echocardiography, P ≥120 ms in lead II had the highest area under the curve (0.81). The V1 terminal criterion came in at 0.59.
- Measure, do not estimate: duration and notch need calipers, or a measured interval on a calibrated tracing. Eyeballing them is not enough.
LVH Strain and the ST-Elevation Mimic
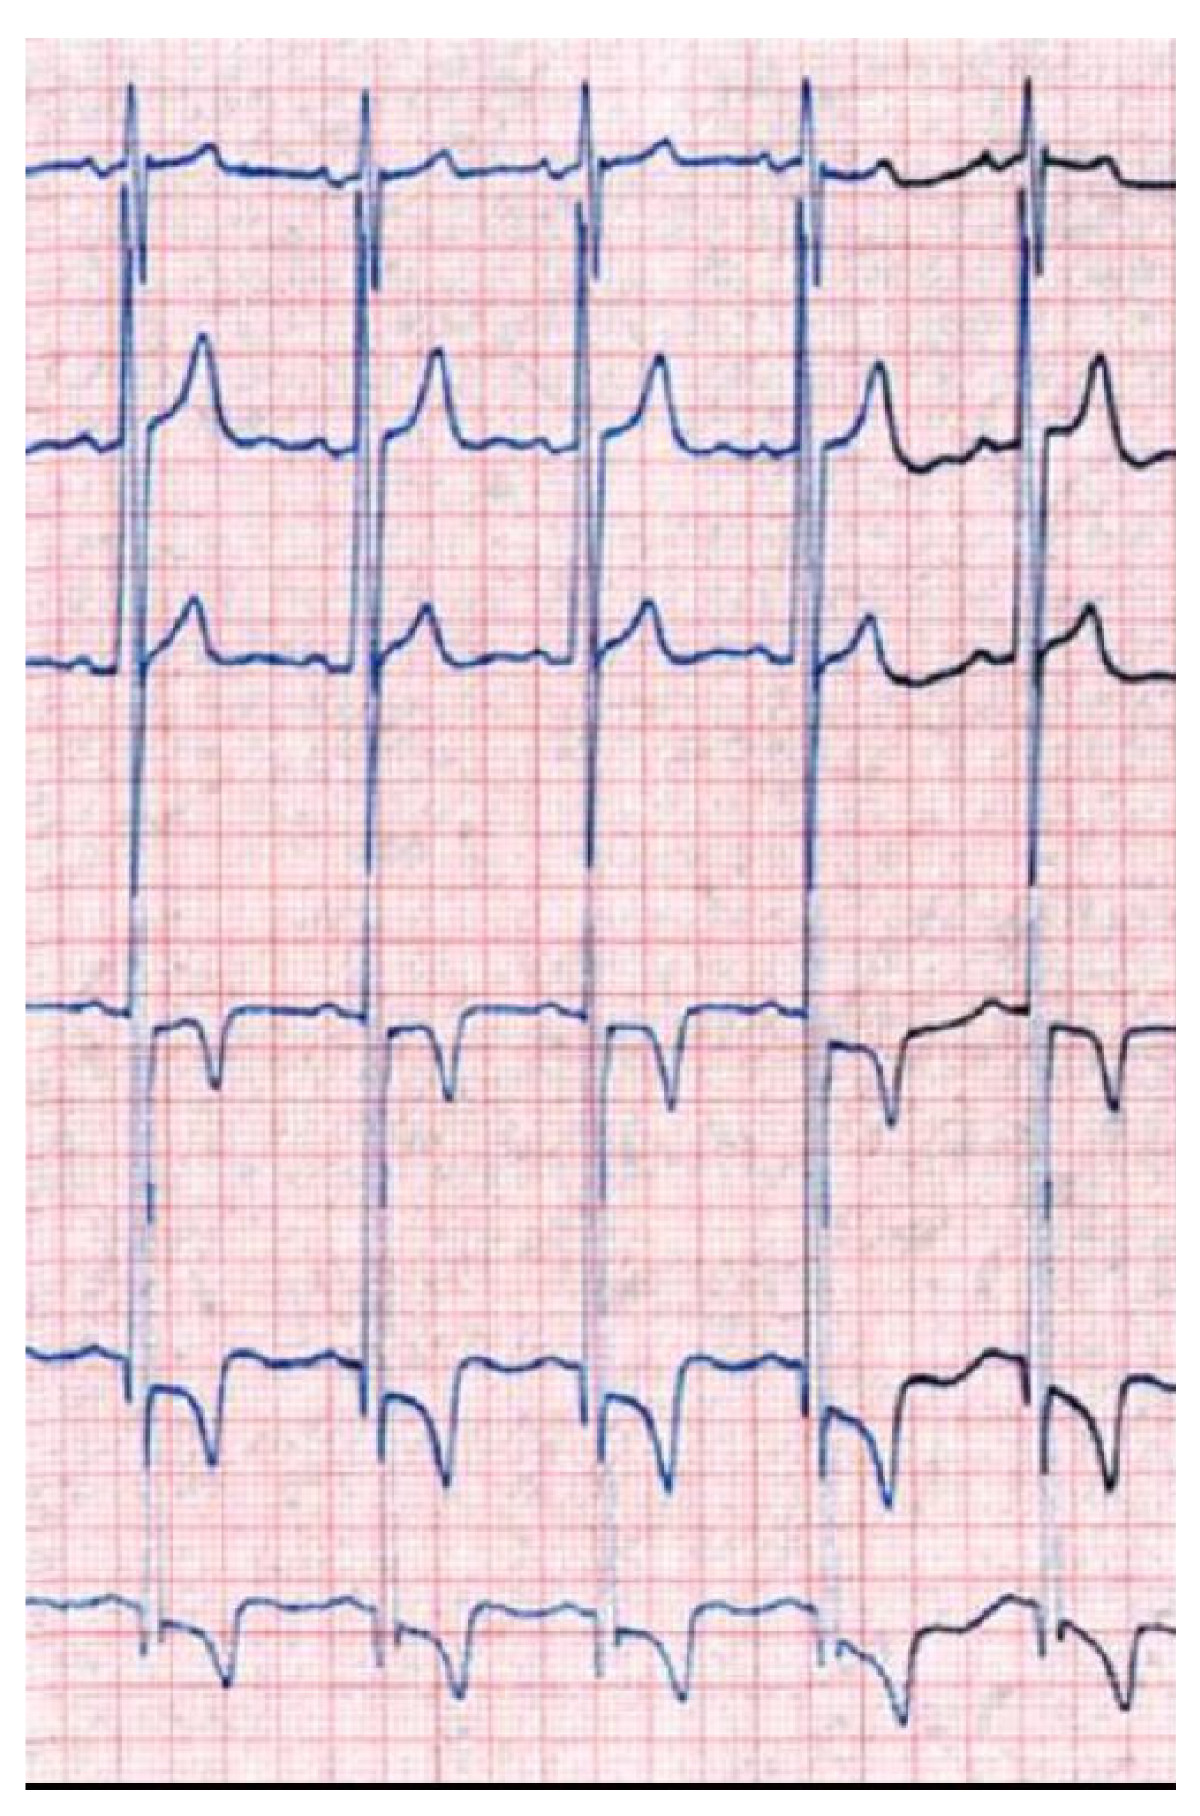
The strain pattern is the repolarization change that rides along with LVH. Look at the leads over the thick left ventricle (typically I, aVL and V5–V6). The ST segment dips and the T wave inverts asymmetrically there. Strain is an ST-T change, not a voltage change, and it can imitate ischemia.
ECG Criteria
- Strain pattern: ST depression and T-wave inversion in I, aVL, V5–V6, opposite to the QRS direction
- Anterior (V1–V3) ST elevation: the deep S waves of LVH come with ST elevation in those same leads. That ST runs against the QRS, opposite the S wave.
- Romhilt-Estes: a typical LVH ST-T change is worth 3 points (1 point with digoxin).
Causes
- LVH itself: the hypertrophy comes first, and the repolarization change follows.
- Hypertrophic cardiomyopathy: septal hypertrophy can build a pseudo-STEMI pattern.
Clinical Significance
- Harm from a false STEMI: a pseudo-STEMI from hypertrophy can lead to unnecessary thrombolysis, dual antiplatelet therapy or urgent catheterization.
- What favours STEMI: new or dynamic change from a prior tracing counts. So does ST elevation that is convex or straight rather than discordant to a deep S wave. Reciprocal ST depression in leads facing away from the territory counts too, and so do symptoms. Strain depression in the left leads does not count as reciprocal change.
- LVH-specific ratio, limited evidence: a 2012 Am J Cardiol registry (PMID 22738872) looked at 79 patients with ECG LVH who went to emergency catheterization. In anterior ST elevation, an ST-to-R-S ratio of 25% or more sharpened specificity for an angiographic culprit lesion (c-statistic 0.82). This comes from one registry, and no outside validation is cited here. The 25% figure is also the Smith-modified Sgarbossa threshold for LBBB and ventricular pacing. Use it only as one observation, alongside a prior tracing and the STEMI pathway. Never use it as a standalone rule.
- What separates them: compare with a prior ECG. A known strain pattern that has not changed is not a new occlusion. For any new or dynamic change, apply the ST-elevation thresholds on the ST Segment & Ischemia page.
Differential Diagnosis & Mimics
It is easy to mistake a voltage pattern for ischemia, pericardial disease or a lead error. The table sets LVH strain against anterior STEMI. That is the mix-up with the most at stake at the bedside.
| Feature | LVH with strain | Anterior STEMI |
|---|---|---|
| Leads | Strain in I, aVL, V5–V6; V1–V3 ST elevation discordant to deep S waves | Contiguous leads in one coronary territory |
| ST shape and reciprocity | Discordant to the QRS; strain depression in the left leads is not reciprocal change | Convex or straight elevation; reciprocal ST depression may appear in leads facing away |
| Prior ECG | Often shows the same pattern | New or dynamic change |
| Voltage | High QRS voltage present | Voltage not part of the diagnosis |
| Next step | Serial 12-leads; echocardiography. STEMI pathway if new, dynamic or symptomatic | STEMI pathway per local protocol |
Artifact & Lead Misplacement
- Precordial placement: V1–V2 set high changes the R/S morphology and can mimic a septal or RV pattern. V4–V6 off the standard positions change the voltage.
- Gain: at half the standard gain, every amplitude halves. The same patient then reads as normal.
- Motion: tremor or shivering shifts the baseline and can hide a P wave.
Normal Variants
- Neonates and young infants: a dominant R in V1 is expected here (see the R Wave page).
Bedside Management & Escalation
A chamber pattern rarely calls for a drug on its own. Act on what the pattern signals: ischemia, right ventricular strain, or a recording error. This page gives no drug doses.
- Chest pain with new ST change or a strain pattern: obtain serial 12-leads and compare with a prior tracing. Activate the STEMI pathway per local protocol when dynamic criteria are met (ALS/RN).
- New right-sided pattern with dyspnea, hypoxia or hypotension: consider pulmonary embolism and acute RV failure. Notify the receiving team early (ALS/RN/CCT).
- Suspected lead error: correct the leads and repeat the ECG before any activation decision (EMT and above).
When a chamber finding is new, get serial 12-leads, electrolytes and an echocardiogram. These are hospital steps, not prehospital actions. Follow local protocols and online medical direction.
Pediatric & Special Populations
Pediatrics
- Adult cut-offs do not apply to children: the Sokolow-Lyon, Cornell and Romhilt-Estes values above are adult values. Use an age-specific ECG reference before you call voltage high or low. This page gives no pediatric chamber limits, because none could be sourced for this topic.
- Newborns and infants: a dominant R in V1 and a right axis of about +60° to +180° are normal in the newborn (see the R Wave page). Do not diagnose RVH from those two findings alone.
- Rate context: read the P wave against the child's heart rate. Age ranges are on the pediatric vital signs page.
Other Populations
- Long-term anabolic-androgenic steroid users: in a 2026 cohort of 100 long-term users, Romhilt-Estes at 5 points had 34% sensitivity. It missed about two-thirds of echo-defined LVH.
- Athletes and young, slim adults: voltage criteria can be met with no disease at all. Echocardiography makes the call.
- Pregnancy: expect a mild left axis shift and nonspecific ST-T change, both common. Before you call a chamber pattern, compare with the prior ECG.
- Chronic lung disease: hyperinflation drags limb voltage down and can mimic P pulmonale and RVH-type criteria. Compare with a prior ECG.
Monitoring & Transport Considerations
| Issue | What to Do |
|---|---|
| Calibration and leads | Check the calibration pulse and V1–V6 placement before reading voltage; note any nonstandard position. |
| Comparison | Send a prior 12-lead with the current one when available; compare lead by lead. |
| Serial tracings | Repeat the 12-lead every 15–30 min during ongoing chest pain, or sooner with a change. |
| Artifact | Movement, vibration or shivering changes baseline and P-wave shape; re-record at rest. |
| Transmission | Label each lead and the time; state the gain and any nonstandard electrode placement. |
Step-by-Step Approach & Pitfalls
- Confirm calibration and lead placement before measuring anything.
- Measure QRS voltage in mm in each lead, then sum the Sokolow-Lyon and Cornell pairs.
- Measure the P wave in lead II for duration and notch, and in V1 for initial and terminal components.
- Score the Romhilt-Estes components, including QRS width and axis.
- Inspect the ST-T pattern in the strain leads and note whether it runs opposite to the QRS.
- Compare with a prior ECG; a new change matters more than a single value.
- Decide: voltage alone goes to echocardiography; new ST change with symptoms goes to the STEMI pathway per protocol.
Common Pitfalls
- Calling LVH on voltage alone without confirming electrode placement or calibration.
- Reading LVH strain as ischemia, or ischemia as strain, without a prior ECG.
- Measuring the P wave in a poorly placed lead; use II and V1.
- Attributing a dominant R in V1 to RVH before excluding right bundle branch block, posterior MI and WPW.
- Using adult thresholds in a child.
- Applying voltage criteria to a tracing with LBBB, ventricular pacing or WPW pre-excitation.
Clinical Pearls
References
- Hancock EW, Deal BJ, Mirvis DM, Okin P, Kligfield P, Gettes LS, et al. AHA/ACCF/HRS recommendations for the standardization and interpretation of the electrocardiogram: part V: electrocardiogram changes associated with cardiac chamber hypertrophy (landmark standardization statement). Circulation. 2009;119:e251–e261. https://doi.org/10.1161/CIRCULATIONAHA.108.191097
- Sokolow M, Lyon TP. The ventricular complex in left ventricular hypertrophy as obtained by unipolar precordial and limb leads (landmark voltage criteria). Am Heart J. 1949;37:161–186. https://doi.org/10.1016/0002-8703(49)90562-1
- Romhilt DW, Estes EH. A point-score system for the ECG diagnosis of left ventricular hypertrophy (landmark derivation paper). Am Heart J. 1968;75:752–758. https://doi.org/10.1016/0002-8703(68)90035-5
- Puthenpura MM, Sipko J, Sankar PR, et al. Correlating left atrial enlargement and left ventricular hypertrophy on ECG with echocardiography and cardiac magnetic resonance imaging. J Am Heart Assoc. 2025;14:e037772. https://doi.org/10.1161/JAHA.124.037772
- Abdullah R, Bjørnebekk A, Hauger LE, et al. Evaluating ECG criteria for diagnosing left ventricular hypertrophy in anabolic-androgenic steroid users. JACC Adv. 2026;5:102499. https://doi.org/10.1016/j.jacadv.2025.102499
- Gupta P, Jain H, Gill M, et al. Electrocardiographic changes in emphysema. World J Cardiol. 2021;13:533–545. https://doi.org/10.4330/wjc.v13.i10.533
- Hamed M, Dasari G, Casale JA, et al. The use of Romhilt-Estes criteria in the presumptive electrocardiographic diagnosis of left ventricular hypertrophy in comparison to voltage-based criteria. Cureus. 2022;14:e28003. https://doi.org/10.7759/cureus.28003
- Lekwa C, Thahakutty AH, Ahmad S, Attar N. Pseudo-anterior ST-elevation myocardial infarction due to hypertrophic cardiomyopathy. Cureus. 2025;17:e97693. https://doi.org/10.7759/cureus.97693
- Moak JH, Muck AE, Brady WJ. ST-segment elevation myocardial infarction mimics: the differential diagnosis of nonacute coronary syndrome causes of ST-segment/T-wave abnormalities in the chest pain patient. Turk J Emerg Med. 2024;24(4):206–217. https://doi.org/10.4103/tjem.tjem_137_24
- Namjouyan K, Sejdić E, Link MS, et al. Precision medicine for electrocardiogram interpretation: clinical relevance, challenges, and advances. Rev Cardiovasc Med. 2025;26:47007. https://doi.org/10.31083/rcm47007
Medical Disclaimer
- For Educational Purposes Only: This content is intended for educational reference and should not be used for clinical decision-making.
- Not a Substitute for Professional Judgment: Always consult your local protocols, institutional guidelines, and supervising physicians.
- Verify Before Acting: Users are responsible for verifying information through authoritative sources before any clinical application.