

Bedside Snapshot
- Normal (Adult)
- RDW-CV 11.5–14.5% (same in SI)
RDW-SD in fL is analyzer-specific; newborns run 15.5–20% - Critical Values
- No universal critical value for RDW: interpret with MCV, hemoglobin and trend (typical; lab-specific)
- High Suggests
- Fragmentation or hemolysis (TTP, HUS, DIC, sickle cell)
- Iron deficiency, often before MCV falls
- B12 or folate deficiency
- Recent transfusion, mixed deficiency, MDS
- Low Suggests
- Rarely clinically significant: a low RDW only means the red cells are uniform in size
- Act Now If
- High RDW with new anemia, low platelets, jaundice or bleeding: treat perfusion first, ask for a smear for schistocytes and send the anemia workup before transfusing
- Watch Out For
- A recent transfusion raises the RDW within hours: use the pre-transfusion CBC for the anemia workup and for risk scoring
Reference & Critical Ranges
Reference ranges
| Population | Conventional | SI | Notes |
|---|---|---|---|
| Adult (men and women) | RDW-CV 11.5–14.5% | Same (%) | Typical; most laboratories use roughly 11–15%. No common reference range exists because analyzers differ |
| Adult RDW-SD | Analyzer-specific (fL) | Same (fL) | Use your laboratory's interval; not interchangeable with RDW-CV |
| Pregnancy | Same as adult | Same | Use the adult range unless your laboratory reports a pregnancy-specific interval |
| Older adult | Same as adult | Same | Runs higher with age: community cohorts of older adults had median RDW 13.2–14.6% |
| Neonate (birth to 14 days) | 15.5–20% | Same | Term and late preterm; upper limit up to 23% in preterm neonates |
| Infant and toddler (0 to under 2 years) | Use your laboratory's pediatric interval | Same | Age-specific. CALIPER 2020 was one analyzer (Beckman DxH 900); intervals are not interchangeable across analyzers |
| Child and adolescent (2 to under 21 years) | Use your laboratory's pediatric interval | Same | Age-specific. CALIPER 2020 was one analyzer (Beckman DxH 900); intervals are not interchangeable across analyzers |
Severity & critical values
| Level | Conventional | SI | What it means / typical findings |
|---|---|---|---|
| Low | <11.5% | Same | No recognized clinical significance: the cells are simply uniform in size |
| Normal | 11.5–14.5% | Same | Uniform cell population. With microcytic anemia, favors thalassemia trait or anemia of inflammation, but does not exclude iron deficiency |
| Elevated (anisocytosis) | >14.5% | Same | Mixed cell sizes: iron, B12 or folate deficiency, hemolysis, fragmentation, recent transfusion, marrow disorder or systemic illness. No validated mild/moderate/severe grades exist |
| Critical | None defined | None defined | RDW has no panic value. The danger is the hemoglobin, bleeding or hemolysis behind it |
Conversion: You don't need one. RDW-CV is already a percentage, and RDW-SD is already in fL, an SI unit.
Normal adult RDW-CV sits around 11.5–14.5%. MCV is the divisor, so the same absolute spread produces a higher number when the cells are small.
Causes of Abnormal Results
High (Anisocytosis >14.5%)
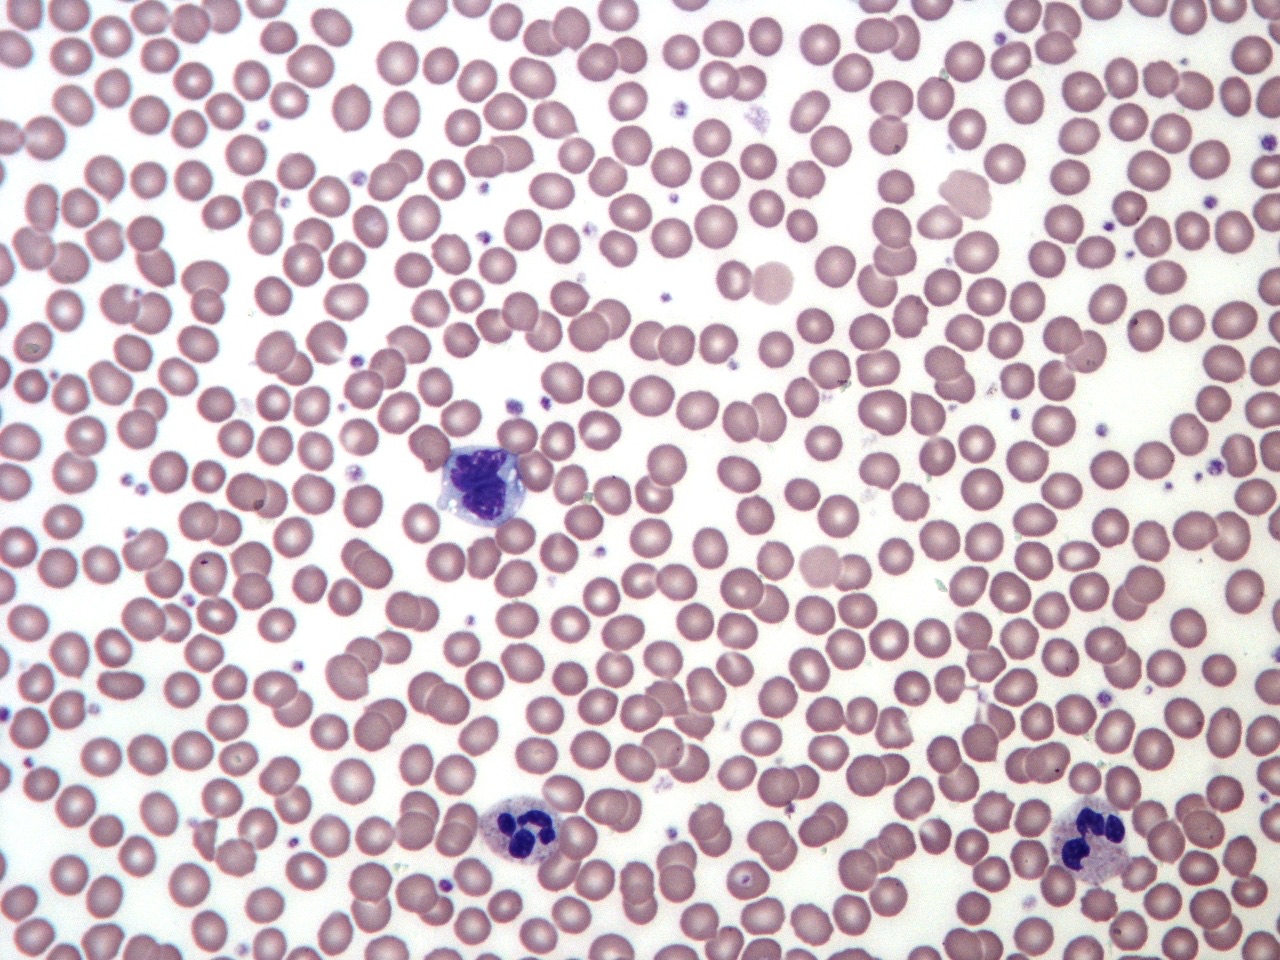
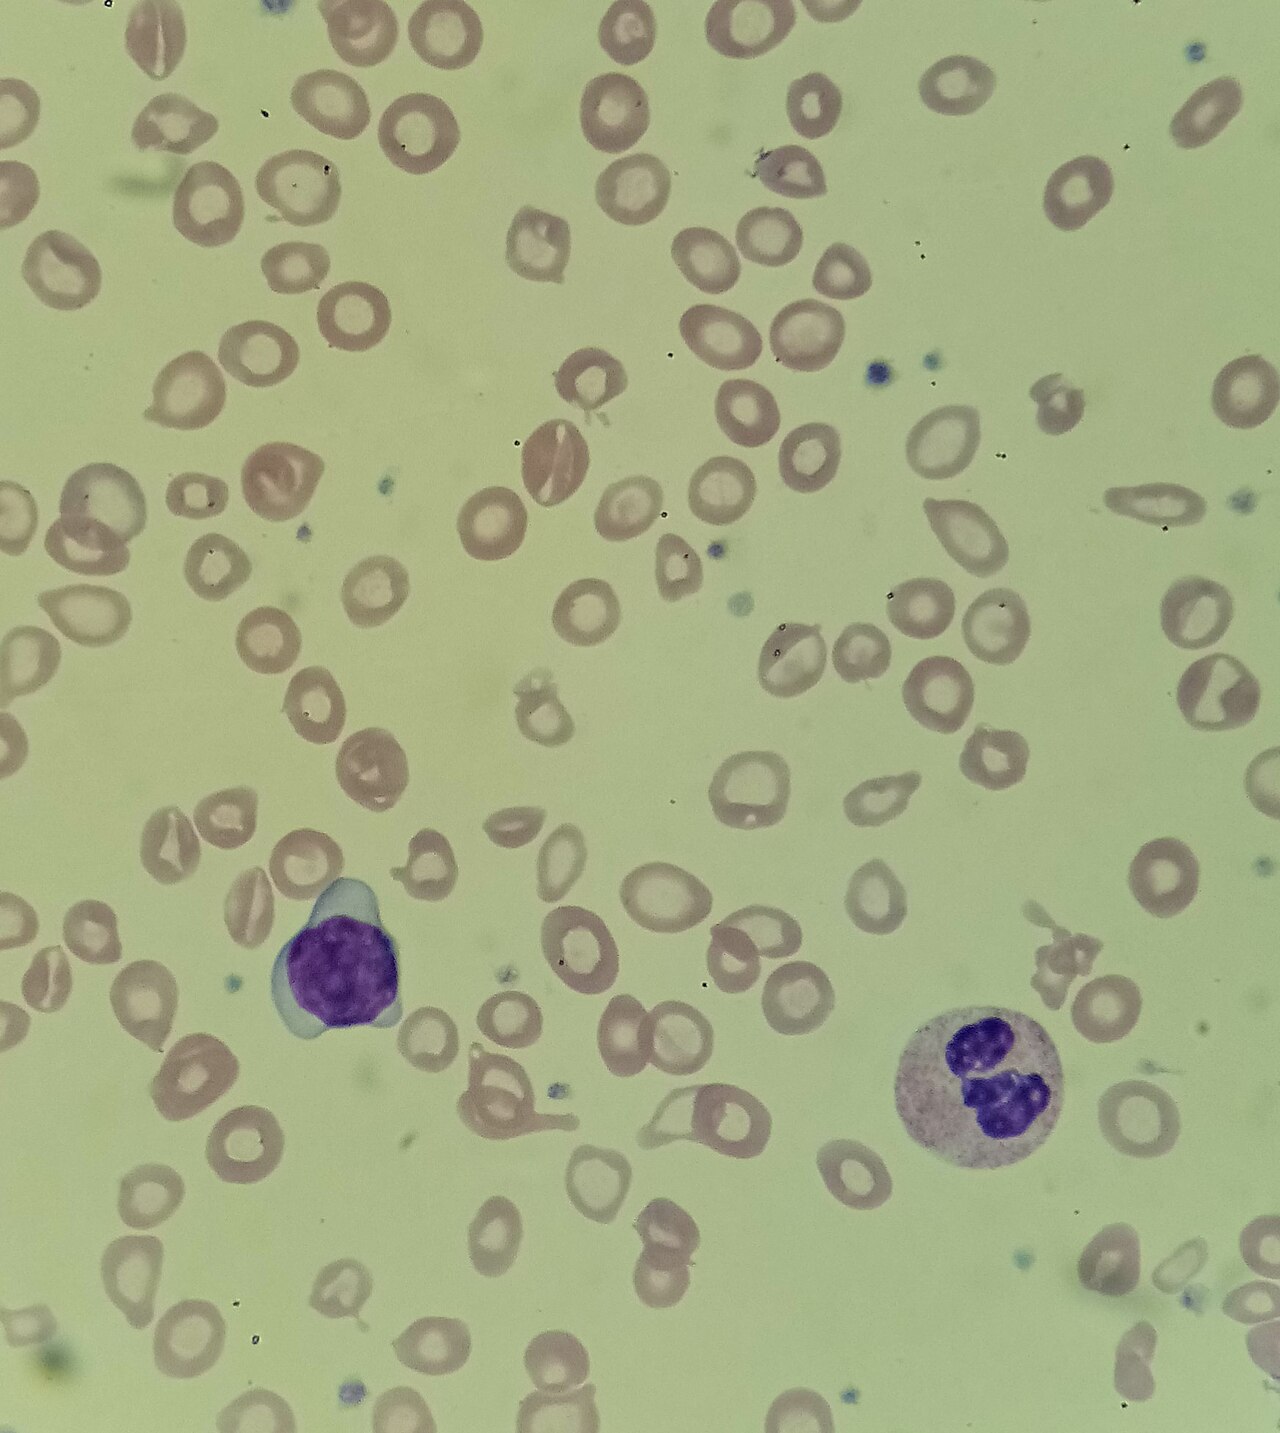
A high RDW means the cells are not all one size. The usual reasons: a burst of new cells, production that is not working, cells that fragment or get destroyed, or a second population of cells sitting beside the first.
| Mechanism | Common causes | Bedside clue |
|---|---|---|
| Red cell fragmentation | Microangiopathic hemolysis: thrombotic thrombocytopenic purpura (TTP), hemolytic uremic syndrome (HUS), disseminated intravascular coagulation (DIC) | Schistocytes on the smear, low platelets, rising creatinine or bleeding: a same-day emergency |
| Hemolysis | Autoimmune hemolytic anemia, sickle cell disease, hereditary spherocytosis | Jaundice, dark urine, falling hemoglobin; high indirect bilirubin and LDH, low haptoglobin |
| Reticulocytosis after blood loss | Recovery from hemorrhage | Large young cells join the normal ones; reticulocyte count is high |
| Iron deficiency | Chronic GI blood loss, heavy menstrual loss, pregnancy, poor intake, malabsorption | Low MCV and MCH, low ferritin. RDW often rises before the MCV falls |
| B12 or folate deficiency | Pernicious anemia, malabsorption, alcohol use, poor diet, drugs such as methotrexate | High MCV; numbness, ataxia or confusion with B12 deficiency |
| Two cell populations | Recent transfusion, mixed iron plus B12/folate deficiency, early response to iron or B12 treatment | Normal MCV with high RDW; two peaks on the RBC histogram (dimorphic) |
| Marrow disorder | Myelodysplastic syndrome (MDS) | Older adult; other cytopenias; abnormal cells on the smear |
| Systemic illness | Heart failure, coronary disease, sepsis, liver failure | High RDW without a hematologic cause; a marker of risk, not a diagnosis |
Low (<11.5%)
A low RDW has no recognized clinical significance. All it tells you is that the cells are uniform. A neonate with an unusually low RDW tends to have a relatively low MCV for age.
Normal RDW with anemia
Anemia with a uniform population points in two directions. Small cells: think thalassemia trait or anemia of inflammation. Normal-sized cells: think acute blood loss before the marrow responds, or anemia of inflammation. A normal RDW does not rule out iron deficiency, because thalassemia trait and iron deficiency overlap.
Interpretation & Bedside Approach
Step-by-step approach
- Is it real? Ask about a transfusion in the past few days. Check the analyzer flags and look at the RBC histogram. Cold agglutinins, fragments and very high lymphocyte counts all distort the size curve.
- How sick is the patient? The RDW never decides emergency care. Hemoglobin, perfusion, active bleeding, hemolysis and the platelet count decide it.
- Acute vs chronic, and the trend: Pull the prior CBCs and compare. A rising RDW with a falling MCV fits iron deficiency that is developing. A sudden jump after a transfusion is expected.
- Read it with the MCV: The RDW means something only beside the cell size. Use the pattern table below.
- Classify with confirmatory tests: Confirm with ferritin and transferrin saturation, reticulocyte count, B12 and folate, and a smear. The RDW and the discriminant indices are only screening clues.
- Escalate or dispose: Symptomatic anemia, bleeding, hemolysis or schistocytes get same-day care. A high RDW in a stable patient gets the next test and a follow-up.
MCV and RDW patterns
The Bessman classification (1983) pairs MCV, which is cell size, with RDW, which is size variation. The categories overlap a lot, so read each cell as a starting point.
| MCV | RDW normal | RDW high |
|---|---|---|
| Low (<80 fL) | Thalassemia trait; anemia of inflammation | Iron deficiency (most common); red cell fragmentation; sideroblastic anemia or Hgb H disease |
| Normal (80–100 fL) | Acute blood loss before the marrow responds; anemia of inflammation | Early iron or folate deficiency; mixed deficiency; sickle cell disease; recent transfusion; MDS |
| High (>100 fL) | RDW adds little: work up as on the MCV page (B12, folate, reticulocytes, liver tests, drugs) | B12 or folate deficiency; hemolysis or recovery from bleeding; MDS; liver disease |
Iron deficiency vs thalassemia trait
Of the 12 discriminant indices studied five or more times (more than 40 have been proposed), the RDW (Bessman index) performed worst in a meta-analysis, with a diagnostic odds ratio of 6.8. Use it with the other clues. Never alone.
| Feature | Iron deficiency | Thalassemia trait |
|---|---|---|
| RDW | Usually high | Often normal, but can be high |
| RBC count | Low or normal | Normal or high |
| Mentzer index (MCV ÷ RBC) | >13 | <13 |
| Ferritin | Low | Normal |
| Confirm with | Ferritin; then find the source of blood loss | Hemoglobin electrophoresis once iron is normal |
RDW as a prognostic marker
- Older adults: Each 1% rise in RDW was linked to about a 14% higher risk of death. The pooled analysis covered 11,827 community-dwelling older adults.
- Heart failure and coronary disease: A higher RDW predicts hospitalization and death, independent of hemoglobin.
- Sepsis: A high RDW on admission is linked to worse short- and long-term outcomes. It has limited value for diagnosing sepsis or bacteremia.
- Use: It's a risk flag that backs up your clinical judgment. It is not a treatment target. No threshold triggers a specific intervention.
Special Populations
| Population | What changes | Clinical implication |
|---|---|---|
| Neonates & infants | RDW is higher at birth (15.5–20%, up to 23% in preterm neonates); later pediatric values use age-specific intervals | Do not call a newborn's RDW of 18% abnormal. Very high values at birth suggest prenatal hemorrhage or hemolysis; a transfusion raises the RDW further |
| Children & adolescents | Age-specific intervals; use your laboratory's pediatric range | A high RDW with microcytosis in a toddler is usually iron deficiency; ask about diet |
| Pregnancy | Iron demand rises; no separate RDW interval in common use | Read a high RDW with the ferritin; iron deficiency is common |
| Older adults | RDW runs higher (community medians 13.2–14.6%) | A mildly high RDW is common and carries prognostic weight; still look for iron or B12 deficiency and MDS |
| Critically ill or recently transfused | A single unit of red cells raises the RDW within hours, peaking about 24 hours later | Use the pre-transfusion value for anemia workup and for risk scoring |
| Other: sickle cell disease, liver failure | RDW often high at baseline | Compare with the patient's own baseline rather than the population range |
Interfering Factors & Pitfalls
Collection & handling
| Factor | Effect | Why | Avoid / fix |
|---|---|---|---|
| Recent transfusion | ↑ | Donor cells differ in size from the patient's own cells | Draw the CBC before transfusing; document units and times |
| Different analyzer or laboratory | Shifts in value | Methods, instruments and statistics differ; no common reference range | Trend on one laboratory where possible; use that laboratory's range |
Physiologic / biologic
| Factor | Effect | Why | Avoid / fix |
|---|---|---|---|
| Cold agglutinins | Unreliable (↑ MCV) | Clumped cells are sized as single large cells | Warm the sample to 37 °C (98.6 °F) and rerun; review the histogram |
| Red cell fragments | ↑ | Small fragments widen the size distribution | Smear review for schistocytes |
| Very high lymphocyte count | Unreliable | Lymphocytes can be counted as red cells | Smear and histogram review |
| Reticulocytosis | ↑ (true) | Young cells are larger than mature cells | Check a reticulocyte count |
| Low MCV | ↑ RDW-CV | RDW-CV divides the spread by the MCV | Compare with RDW-SD if your laboratory reports it |
Medications & supplements
| Factor | Effect | Why | Avoid / fix |
|---|---|---|---|
| Starting iron, B12 or folate treatment | ↑ (true, transient) | New normal-sized cells mix with the old abnormal ones | Expected; follow hemoglobin and reticulocytes, not the RDW, for early response |
Common misinterpretations
- "Normal RDW, so not iron deficiency": Iron deficiency and thalassemia trait overlap. Check the ferritin.
- "High RDW, so it is iron deficiency": B12/folate deficiency, hemolysis, fragmentation, transfusion and MDS all push it up.
- "RDW rose after treatment, so treatment failed": A temporary rise is expected. New cells are showing up.
- "Low RDW is abnormal": It carries no recognized clinical meaning.
Physiology & Test Basics
What it measures
This page is about RDW, which measures how much red cell size varies (anisocytosis). Its siblings measure average cell size (MCV), hemoglobin per cell (MCH) and hemoglobin concentration inside cells (MCHC). The RBC indices page compares all four. You'll see two forms. RDW-CV is a percentage. RDW-SD is an absolute width in fL.
Physiology & regulation
- Healthy blood: Red cells are made at a steady rate and look alike. The size curve stays narrow.
- New cells: After bleeding, hemolysis or the start of treatment, production surges. Larger young cells join the mix.
- Faulty production: Iron shortage makes small cells. B12 or folate shortage makes large ones. Older normal cells still circulate beside them.
- Loss or damage: Fragmentation and hemolysis add small fragments and spherocytes to the mix.
- Slow turnover: Red cells live about 120 days. A mixed population takes months to clear.
- Systemic illness: We don't fully know why RDW tracks mortality. Inflammation and disturbed red cell production are the leading explanations.
How it is measured
- Specimen: whole blood in a lavender-top tube (K₂EDTA), part of every CBC; fill to the line and invert gently.
- Method: The analyzer sizes thousands of cells and plots a volume histogram. RDW-CV is the standard deviation of cell volume divided by the MCV. RDW-SD is the width of the curve itself. It does not depend on the MCV.
- Timing: No fasting needed. The result comes back with the CBC.
Why it matters
In the ED, the ICU and during transport, RDW helps separate iron deficiency, B12 or folate deficiency and hemolysis when you read it with the MCV. It reveals a hidden second cell population. It also flags higher risk in heart failure, sepsis and older adults.
Clinical Pearls
References
- Arkew, M., Gemechu, K., Haile, K., & Asmerom, H. (2022). Red blood cell distribution width as novel biomarker in cardiovascular diseases: A literature review. Journal of Blood Medicine, 13, 413–424. https://doi.org/10.2147/JBM.S367660
- Tahmasebi, H., Higgins, V., Bohn, M. K., Hall, A., & Adeli, K. (2020). CALIPER hematology reference standards (I): Improving laboratory test interpretation in children. American Journal of Clinical Pathology, 154(3), 330–341. https://doi.org/10.1093/ajcp/aqaa059
- Christensen, R. D., Yaish, H. M., Henry, E., & Bennett, S. T. (2015). Red blood cell distribution width: Reference intervals for neonates. Journal of Maternal-Fetal & Neonatal Medicine, 28(8), 883–888. (landmark study) https://doi.org/10.3109/14767058.2014.938044
- Bessman, J. D., Gilmer, P. R., & Gardner, F. H. (1983). Improved classification of anemias by MCV and RDW. American Journal of Clinical Pathology, 80(3), 322–326. (landmark derivation paper) https://doi.org/10.1093/ajcp/80.3.322
- Hoffmann, J. J., Urrechaga, E., & Aguirre, U. (2015). Discriminant indices for distinguishing thalassemia and iron deficiency in patients with microcytic anemia: A meta-analysis. Clinical Chemistry and Laboratory Medicine, 53(12), 1883–1894. (landmark meta-analysis) https://doi.org/10.1515/cclm-2015-0179
- Patel, K. V., Semba, R. D., Ferrucci, L., Newman, A. B., Fried, L. P., Wallace, R. B., et al. (2010). Red cell distribution width and mortality in older adults: A meta-analysis. Journals of Gerontology, Series A, 65(3), 258–265. (landmark meta-analysis) https://doi.org/10.1093/gerona/glp163
- Hu, Z. D., Lippi, G., & Montagnana, M. (2020). Diagnostic and prognostic value of red blood cell distribution width in sepsis: A narrative review. Clinical Biochemistry, 77, 1–6. https://doi.org/10.1016/j.clinbiochem.2020.01.001
- Spadaro, S., Taccone, F. S., Fogagnolo, A., Franchi, F., Scolletta, S., Ragazzi, R., et al. (2018). The effects of blood transfusion on red blood cell distribution width in critically ill patients: A pilot study. Transfusion, 58(8), 1863–1869. https://doi.org/10.1111/trf.14759
Medical Disclaimer
- For Educational Purposes Only: This content is intended for educational reference and should not be used for clinical decision-making.
- Not a Substitute for Professional Judgment: Always consult your local protocols, institutional guidelines, and supervising physicians.
- Verify Before Acting: Users are responsible for verifying information through authoritative sources before any clinical application.