

At a Glance
- Represents
- A fixed read of all 12 leads: rate, rhythm, axis, intervals, morphology, ST-T waves and comparison with a prior ECG, in the same order every time.
- Normal (Adult)
- Rate 60–100 bpm; axis −30° to +90°; PR 120–200 ms; QRS <110 ms; QTc <450 ms (men) or <460 ms (women).
- Measure It
- Calibration 25 mm/s and 10 mm/mV first. Rate and rhythm on the rhythm strip; axis from leads I and aVF; intervals in the clearest leads.
- Abnormal → Think
- Any step outside range, a new ST change, or a difference from the prior ECG. Each finding has its own owner page.
- Red Flags
- New ST elevation with symptoms: STEMI pathway per local protocol
- Wide complex at a fast rate: VT until proven otherwise
- Bedside Action
- Unstable: treat the rhythm per its page now. Suspected MI: repeat the 12-lead and notify. Stable: finish the six steps, then escalate.
Physiology & What It Represents
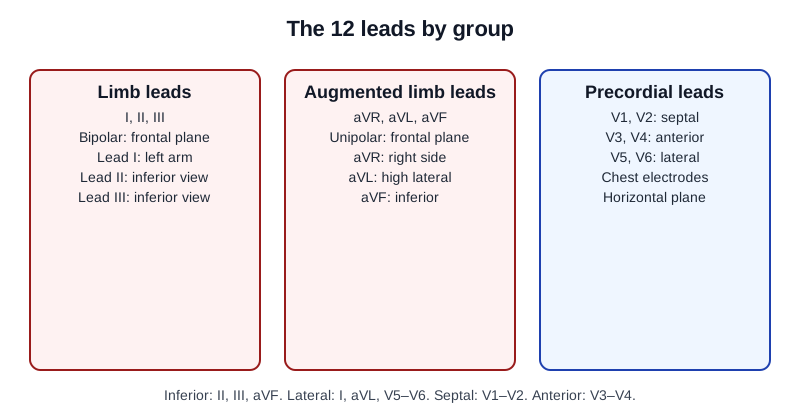
A 12-lead ECG is one recording with 12 views of the heart, all taken at the same moment. The six limb leads (I, II, III, aVR, aVL, aVF) view it from the front, in the frontal plane. The six precordial leads (V1–V6) view it across the chest, in the horizontal plane. Read every beat on every lead from left to right: the P wave (atrial depolarization), the PR segment, the QRS complex (ventricular depolarization), the ST segment and the T wave (ventricular repolarization).
The signal starts at the SA node and runs through the atria. It pauses at the AV node. Then it drops through the His–Purkinje system into the ventricular muscle. So the PR interval measures atrial activation plus the pause at the AV node. Why a fixed order? One lead can hide a finding. An ST change may show only in V2 and V3. A rhythm may change only after a pause. The order is what catches them.
Normal Values & How to Measure
Measure every interval the same way on every tracing. Amplitude is in millimeters (mm). 1 mm = 0.1 mV. Duration is in milliseconds (ms). 1 small box = 40 ms (0.04 s).
| Parameter | Adult Normal | Pediatric Note | Where / How to Measure |
|---|---|---|---|
| Heart rate | 60–100 bpm | Age-specific; see Pediatric & Special Populations | Rhythm strip; 300 ÷ large boxes (regular) or QRS count × 10 in 6 s |
| Rhythm | Sinus: one P before each QRS, fixed PR | Sinus arrhythmia can be normal in children | Longest rhythm strip, usually lead II |
| Axis | −30° to +90° | Age-dependent | Leads I and aVF |
| PR interval | 120–200 ms (0.12–0.20 s; 3–5 small boxes) | Use age-specific references | Start of P to start of QRS, lead II |
| QRS duration | <110 ms (under 3 small boxes) | Use age-specific references | Widest lead, onset to J point |
| QTc | <450 ms (men); <460 ms (women) | Use a pediatric reference | Lead with the clearest T-wave end; correct for rate |
Before step 1, confirm the calibration: paper speed 25 mm/s and gain 10 mm/mV. Get that wrong and every amplitude and rate you read is off. A half-size or double-size tracing does exactly that.
- Rate: count it on the longest rhythm strip, usually lead II.
- Rhythm: check regularity and the P–QRS relationship on the same strip.
- Axis: normal when lead I and lead aVF are both positive.
- Intervals: measure PR, QRS and QT in the leads where onset and end are clearest, not in the lead with the smallest complex.
- Morphology: compare V1 with V6 on the same beat and look for bundle branch patterns, Q waves and voltage.
- ST segments and T waves: read them in contiguous leads, adding posterior and right-sided leads when the pattern calls for them, and compare with a prior tracing.
Abnormal Rate or Rhythm
Rate and rhythm come first. They set the urgency. A rate under 60 bpm, a rate over 100 bpm or an irregular rhythm sends you to the page that owns that rhythm family. Counting methods live on Heart Rate. This section only sorts the findings.
ECG Criteria
- Rate: 60–100 bpm normal. Under 60 bpm is bradycardia; over 100 bpm is tachycardia.
- Regularity: regular or irregular R–R intervals. Irregular R–R with no discrete P waves and fibrillatory activity of 350–600 per minute suggests atrial fibrillation.
- P–QRS relationship: one P before each QRS in sinus rhythm. A P wave with no QRS, or QRS with no P, points to a block or an ectopic rhythm.
- Wide complex at a fast rate: QRS ≥120 ms at over 100 bpm is ventricular tachycardia until proven otherwise.
Causes
- Slow: sinus slowing, AV block, junctional or ventricular escape.
- Fast: sinus tachycardia, atrial fibrillation or flutter, supraventricular tachycardia, ventricular tachycardia.
Clinical Significance
- Poor perfusion with a rate or rhythm change is an immediate problem. Pull up the page for that family: Heart Rate, Atrial Rhythms, Ventricular Rhythms or Conduction Blocks.
Axis Deviation
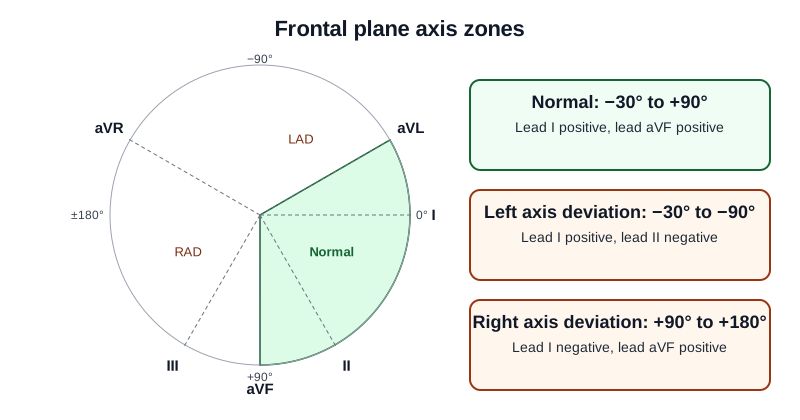
The frontal-plane axis is the average direction the ventricles activate in. Read it from leads I and aVF. Positive in both means a normal axis.
ECG Criteria
- Normal: −30° to +90°; lead I and lead aVF positive.
- Left axis deviation: −30° to −90°; lead I positive, lead II negative.
- Right axis deviation: +90° to +180°; lead I negative, lead aVF positive.
- Extreme (northwest) axis: −90° to ±180°; lead I and lead aVF both negative.
Causes
- Left: left anterior fascicular block, inferior infarction, left ventricular hypertrophy.
- Right: right ventricular hypertrophy, pulmonary embolism, left posterior fascicular block (only after the other causes are excluded).
Clinical Significance
- A new extreme axis with dyspnea, hypotension or tachycardia? Think pulmonary embolism or right-heart strain. Evaluate urgently, per local protocol.
- Fascicular blocks, and how they shift the axis, are on Cardiac Axis.
Prolonged or Short Intervals
Each interval times one stage: the atria, the AV node, the ventricles and repolarization. Each has its own normal range and its own page.
ECG Criteria
- PR: 120–200 ms (0.12–0.20 s). Over 200 ms is first-degree AV block; under 120 ms is short.
- QRS: <110 ms normal; 110–119 ms incomplete block; ≥120 ms wide.
- QTc: prolonged at ≥450 ms in men or ≥460 ms in women; ≥500 ms, or a rise of ≥60 ms from baseline, is high torsades risk.
- Correction: Bazett over-corrects at high rates and under-corrects at low rates. Prefer Fridericia or Framingham when the rate is under 60 or over 90–100 bpm.
Causes
- Long PR: AV-nodal blocking drugs, vagal tone, inferior ischemia.
- Short PR: pre-excitation (Wolff-Parkinson-White), junctional rhythm.
- Long QTc: QT-prolonging drugs, low potassium or magnesium, congenital long QT.
Clinical Significance
- Seeing a QTc of ≥500 ms, or a rise of ≥60 ms? Review drugs and electrolytes, and keep monitoring continuously. More detail is on QT Interval.
- A short PR with a delta wave is pre-excitation. The full entry is on PR Interval.
Abnormal QRS Morphology or Voltage
The QRS shape shows how the ventricles activate, and it hints at how thick their walls are. Go lead by lead. Compare each lead with the same beat in another lead.
ECG Criteria
- Bundle branch block: QRS ≥120 ms with an RBBB or LBBB pattern in V1 and V6. See QRS Complex.
- LVH voltage: Sokolow-Lyon S(V1) + R(V5 or V6) ≥35 mm; Cornell R(aVL) + S(V3) >28 mm in men or >20 mm in women.
- Pathologic Q: any Q ≥20 ms (or QS) in V2–V3; or Q ≥30 ms and ≥1 mm deep in two contiguous leads of I/aVL/V6, V4–V6 or II/III/aVF.
Causes
- Conduction: bundle branch block, fascicular block, ventricular pacing, pre-excitation.
- Structural: left or right ventricular hypertrophy; prior infarction for pathologic Q waves.
Clinical Significance
- New LBBB by itself is not a STEMI equivalent. Check for a Sgarbossa-type pattern before you decide (see the next section).
- Treat pathologic Q waves as old until shown otherwise. Pull the prior tracing before you call them new.
ST Elevation
Nothing on the 12-lead is more time-sensitive than ST elevation. Your yardsticks are the Fifth Universal Definition of Myocardial Infarction (2026) and local STEMI criteria. Check the ST segment in every lead.
ECG Criteria
- Standard: new J-point ST elevation of ≥1 mm in two contiguous leads, except V2–V3.
- V2–V3: ≥2 mm in men aged 40 or older; ≥2.5 mm in men under 40; ≥1.5 mm in women.
- Posterior (V7–V9): ST depression ≥1 mm in V1–V3 suggests posterior infarction, and ST elevation in V7–V9 confirms it. Long-standing UDMI thresholds (Fourth UDMI, 2018): ≥0.5 mm (≥1 mm in men under 40).
- Right-sided (V3R–V4R): long-standing UDMI thresholds (Fourth UDMI, 2018): ≥0.5 mm (≥1 mm in men under 30). Confirm the current right-sided criteria against local protocol and the Fifth UDMI before attributing numbers to it.
- LBBB or ventricular pacing: use the Smith-modified Sgarbossa criteria: concordant ST elevation ≥1 mm; concordant ST depression ≥1 mm in V1–V3; discordant ST elevation with ST/S ratio ≥25%.
Causes
- Ischemic: acute coronary occlusion (occlusion MI).
- Non-ischemic: pericarditis, early repolarization, left ventricular aneurysm.
Clinical Significance
- Up to 1 in 4 patients managed as NSTEMI, with no classic ST elevation on a 12-lead, still have an acute culprit occlusion. ST-elevation criteria miss some of them. Look at STEMI Equivalents & Occlusion MI for posterior, de Winter, hyperacute T and Sgarbossa-positive patterns.
- Inferior ST elevation can mean the right ventricle is in trouble too. Get V4R before you call an inferior pattern isolated.
- Territory maps and STEMI equivalents are on ST Segment & Ischemia.
ST Depression and T-Wave Inversion
ST depression and T-wave inversion can mirror ST elevation on the opposite wall. They can also signal ischemia, or they can be non-ischemic. Read them against the ST elevation criteria above.
ECG Criteria
- ST depression: horizontal or downsloping ST segment in contiguous leads; reciprocal depression opposite a STEMI.
- T-wave inversion: new inversion in leads with a normal QRS; compare with the prior tracing.
- Diffuse ST depression with ST elevation in aVR: a pattern that suggests left main or multivessel ischemia.
Causes
- Ischemic: subendocardial ischemia, reciprocal change, Wellens pattern.
- Non-ischemic: hyperkalemia (peaked T waves), electrolyte change, drug effect.
Clinical Significance
- The Wellens pattern comes before an infarct. It points to critical LAD stenosis, not an active occlusion. Notify urgently and start the ACS pathway, per local protocol.
- Peaked T waves, and how hyperkalemia changes them, are on T Wave.
Differential Diagnosis & Mimics
Four common look-alikes change the plan. Line up their features in the table. Then run the artifact list below before you activate a pathway.
| Feature | STEMI (occlusion) | Pericarditis | Early repolarization |
|---|---|---|---|
| Distribution | Territorial, with reciprocal change | Diffuse, many leads | Mostly V2–V6 and inferior leads |
| Reciprocal ST depression | Usually present | Usually absent | Usually absent |
| PR segment | Usually normal | PR depression; PR elevation in aVR | Normal |
| Change over time | Evolves with the event | Evolves over days | Stable over time |
Artifact & Lead Misplacement
- Limb lead reversal: a swapped arm or leg electrode flips lead I, and aVR and aVL change with it. Check the limb leads before you decide.
- Precordial misplacement: chest leads placed high or low shift where the ST change appears to sit.
- Motion and shivering: can mimic VF or VT. Vibration in a moving ambulance adds noise to the ST segment.
- Electrode artifact: poor skin contact or a loose lead can look like a new pattern. Repeat it with clean lead placement.
Other Mimics
- LVH with repolarization change: ST and T changes sit in a thick-walled territory. Check the voltage and the prior tracing.
- Left ventricular aneurysm: ST elevation that won't go away, with Q waves in one territory. Usually an old infarct is behind it.
- Brugada pattern: coved ST elevation in V1–V2. It is a separate risk with its own pathway.
- Takotsubo and pulmonary embolism: can make ST and T changes that look like an infarct. The clinical picture is what decides.
- Hyperkalemia: peaked T waves plus PR and QRS change can mimic infarction. Details are on Electrolyte ECG.
Bedside Management & Escalation
Your 12-lead decides the next move. Rate, rhythm, axis, interval and ST findings show who needs a call and what comes next, per local protocol and medical direction.
- Rate or rhythm problem: stabilize per the rhythm page for that family, starting from the stability check on Heart Rate.
- New ST elevation, or a positive Sgarbossa pattern in LBBB or pacing: activate the STEMI pathway per local protocol and notify the receiving team.
- QTc of ≥500 ms, or a rise of ≥60 ms: review QT-prolonging drugs, check potassium and magnesium, and monitor continuously.
- Ongoing chest pain or changing symptoms: repeat the 12-lead every 15–30 min and whenever the rhythm or symptoms change.
- Obtain next: serial ECGs, right-sided or posterior leads when indicated, electrolytes, and echocardiography per the receiving team.
Follow local protocols and medical direction.
Pediatric & Special Populations
Pediatrics
- Heart rate: swings widely with age. Use the age-specific ranges on Pediatric Vital Signs. Those ranges draw on Fleming and colleagues' systematic review of pediatric heart-rate ranges.
- Intervals and axis: PR, QRS, QTc and the axis all shift with age. Reach for an age-specific reference, not the adult cut-offs in this table.
- Congenital heart disease and channelopathies: can change any interval. Get the prior ECG and cardiology input before you call a finding new.
- Juvenile T-wave pattern: right-sided dominance with T-wave inversion in V1–V3 is normal in childhood. A right axis is normal in infants. Don't call either one ischemia. Compare with an age-matched reference.
- Drugs: every drug dose for a child is weight-based. Details on Weight-Based Dosing.
Other Populations
- Pregnancy: the axis can drift left, and ST-T changes can be nonspecific. Compare with the prior ECG. A normal pregnancy change is not new disease.
- Obesity: QRS and T-wave voltage often run low, which makes ST changes harder to read. Confirm placement and pull the prior tracing.
- Women: place V4–V6 under the breast tissue, not on top of it. Misplaced leads lower amplitude and change how the ST pattern looks.
- Pacemaker or ICD: the paced QRS is wide, and ST changes are hard to read. Apply the Smith-modified Sgarbossa criteria and compare with a prior ECG.
- Heart transplant: the heart is denervated. Atropine often fails to move the rate. The rate-response points are on Heart Rate.
- Older adults: a baseline bundle branch block or old Q waves are common. That makes the prior tracing matter more.
Monitoring & Transport Considerations
- Rhythm monitoring: lead II is the usual lead for P waves. V1 or a modified chest lead helps you see bundle branch and wide-complex shape.
- Ongoing symptoms: repeat the 12-lead every 15–30 min while chest pain continues, and after any change in rhythm.
- Extra leads: V4R catches right-sided ST changes. V7–V9 catches posterior changes. Add them when the pattern calls for it.
- Transmission: send the 12-lead per local protocol where it is allowed, and note the time of acquisition.
- Artifact: vibration, shivering and movement can fake VF or an ST change. Stop or reposition the patient, then repeat the tracing.
- Before moving an unstable patient: check the anterior–posterior pads and confirm capture if pacing is in use.
- QT-prolonging infusions: set alarm limits and monitor continuously.
Step-by-Step Approach & Pitfalls
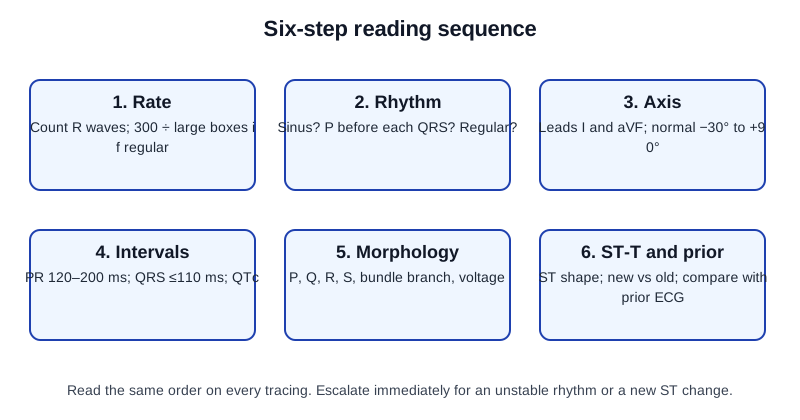
Before step 1, confirm the patient, time, lead placement, paper speed 25 mm/s and calibration 10 mm/mV.
- Rate: count it on the longest rhythm strip, usually lead II.
- Rhythm: check regularity and the P–QRS relationship on the same strip.
- Axis: from leads I and aVF.
- Intervals: measure PR, QRS and QTc in the clearest leads.
- Morphology: look for a bundle branch pattern, pathologic Q waves and voltage.
- ST-T waves and prior: check the ST segments and T waves in contiguous leads, adding posterior and right-sided leads when the pattern calls for them, then label every finding new or old against the prior ECG.
After step 6, name the finding and escalate per local protocol and medical direction.
Common Pitfalls
- Reading the rhythm from one lead only, when the P waves are clearer in another.
- Using Bazett at high or low rates without a second formula.
- Missing a limb lead reversal before calling an infarct pattern.
- Calling a new LBBB a STEMI, or missing a Sgarbossa-positive pattern in LBBB.
- Comparing two tracings measured in different leads.
- Skipping the prior tracing when one is available.
Clinical Pearls
References
- Kligfield P, et al. (2007). Recommendations for the standardization and interpretation of the electrocardiogram. Circulation. 2007;115:1306–1324 (landmark standardization statement). https://doi.org/10.1161/CIRCULATIONAHA.106.180200
- Surawicz B, et al. (2009). AHA/ACCF/HRS recommendations for the standardization and interpretation of the electrocardiogram: Part III: Intraventricular conduction disturbances. Circulation. 2009;119(10):e235–e240. https://doi.org/10.1161/circulationaha.108.191095
- Fifth Universal Definition of Myocardial Infarction (2026). European Heart Journal. Published online August 28, 2026. https://doi.org/10.1093/eurheartj/ehag101
- Rao SV, et al. (2025). 2025 ACC/AHA/ACEP/NAEMSP/SCAI Guideline for the Management of Patients With Acute Coronary Syndromes. Circulation. 2025;151(13). https://doi.org/10.1161/CIR.0000000000001309
- Sgarbossa EB, et al. (1996). Electrocardiographic diagnosis of evolving acute myocardial infarction in the presence of left bundle-branch block (landmark trial). New England Journal of Medicine. 1996;334:481–487. https://doi.org/10.1056/NEJM199602223340801
- Smith SW, et al. (2012). Diagnosis of ST-elevation myocardial infarction in the presence of left bundle branch block with the ST-elevation to S-wave ratio in a modified Sgarbossa rule. Annals of Emergency Medicine. 2012;60(6):766–776. https://doi.org/10.1016/j.annemergmed.2012.07.119
- Fleming S, et al. (2011). Normal ranges of heart rate and respiratory rate in children from birth to 18 years of age: a systematic review of observational studies. Lancet. 2011;377(9770):1011–1018. https://doi.org/10.1016/S0140-6736(10)62226-X
Medical Disclaimer
- For Educational Purposes Only: This content is intended for educational reference and should not be used for clinical decision-making.
- Not a Substitute for Professional Judgment: Always consult your local protocols, institutional guidelines, and supervising physicians.
- Verify Before Acting: Users are responsible for verifying information through authoritative sources before any clinical application.